Introduction to Course Dashboard in MindScroll LMS
This is an easy-to-follow step-by-step guide to get access to course dashboard reports into your MindScroll LMS account.
- Navigate to Dashboard: To access and follow the given steps, login as an "Admin" or "Instructor" into your MindScroll LMS.
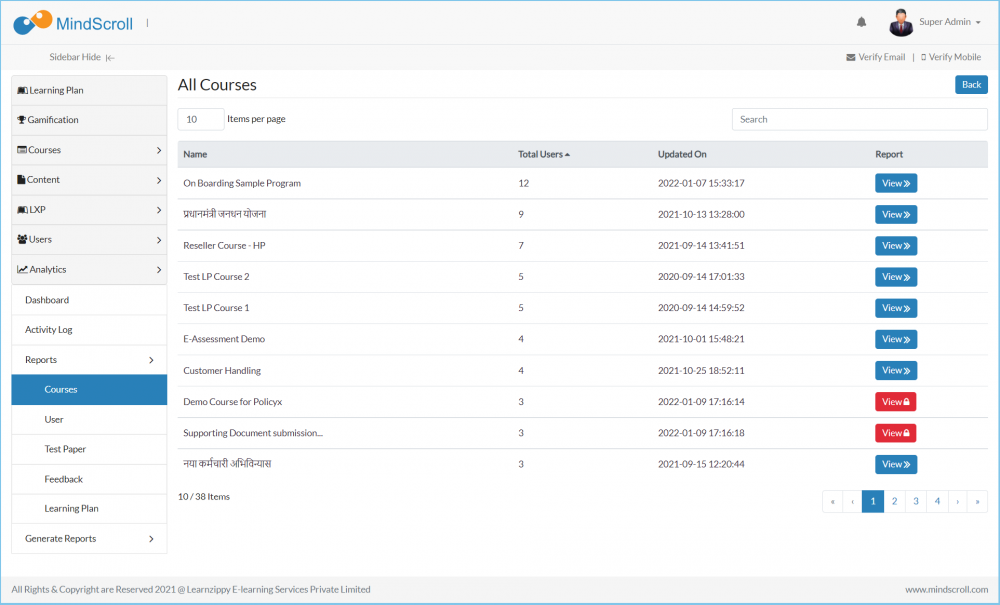
To access the visual course report, click on Analytics ~> Reports ~> Course in the left navigation menu.
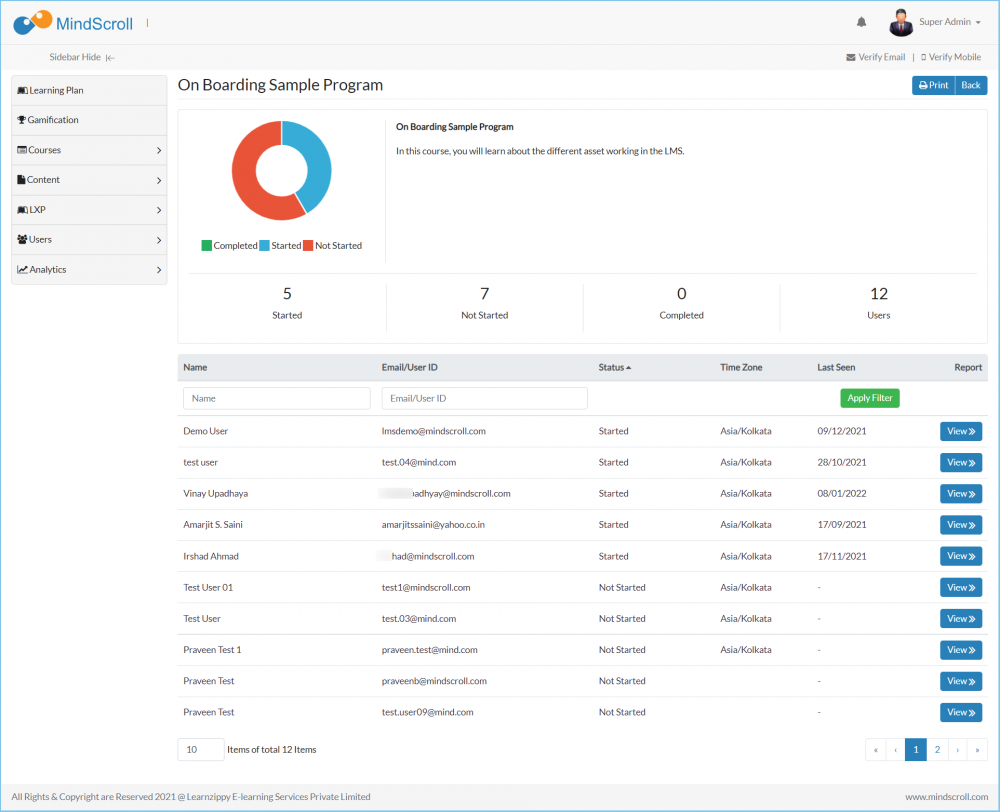
Click on the "View" button, parallel to the user that is looking forward to checking.
The Course Progress Report shows a summary of Course Progress for individual users along with details of progress on assets and sections within the course.
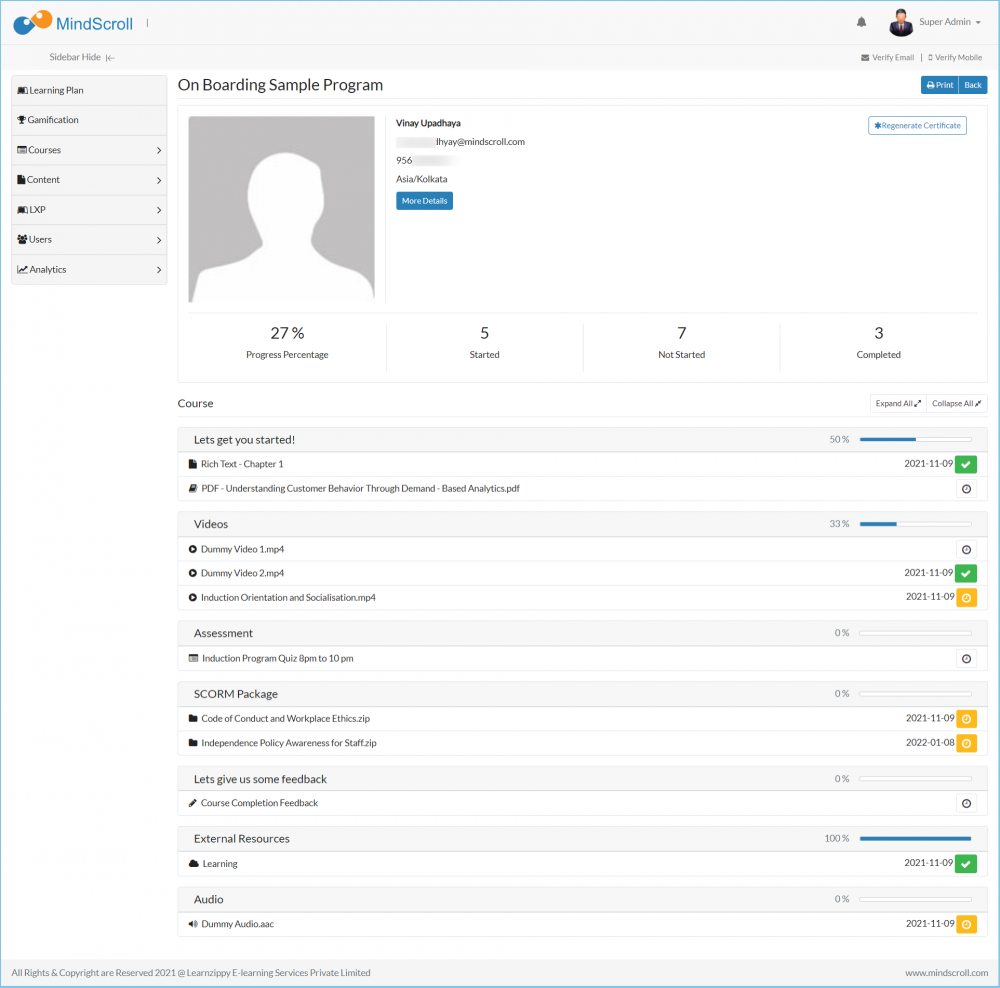
To top section of the Report shows Course and User information like Course Title, User name, User email address, User Profile Picture along with summary progress statistics.
Below are the Summary Statistics along with their description:
- Progress % - Overall Course Progress of the user as a percentage of number of assets completed (a value of 50% implies that the user has completed 50% assets of the course).
- In Progress - Number of assets of the course which the user has started but not completed (Completion status for assets is 'In Progress' for the user).
- Not Started - Number of assets of the course which the user has not started yet.
- Completed - Number of assets of the course which the user has completed.
The second half of the report shows section-wise progress along with progress status for each asset.
Section-wise progress shows the Progress of the user as a percentage of number of assets completed within the section (a value of 50% implies that the user has completed 50% assets of the section)
Asset wise Progress Status indicates the progress status of each asset for the user. Below are the different statuses along with their description:

White Clock icon - indicates the asset has not been started.

Orange Clock icon - indicates the asset is 'In Progress'. The date alongside the icon indicates the date on which the asset was last accessed.

Green Tick icon - indicates the asset has been 'Completed'. The date alongside the icon indicates the date on which the asset was completed
Please Note: To know more about dashboard reports, please refer to other respective documentation present in the category.
Admin Dashboard, Administrator, Administrator Feature, Analytics, Dashboard Report, How to Guide, Instruction, Knowledge, LMS Platform Navigation, View Reports


